
Overview


Introduction


Multiple sequence alignment (MSA) is a prerequisite for virtually all comparative sequence analyses, including phylogeny reconstruction, functional motif or domain characterization, sequence-based structural alignment, inference of positive selection, and profile-based homology searches. All such analyses take the MSA input for granted, regardless of uncertainties in the alignment. Since errors in upstream stages tend to cascade downstream, alignment errors are an important concern in molecular data analysis.

The GUIDANCE web server is a powerful and user-friendly tool for assigning confidence scores to each residue, column, and sequence in an alignment and for projecting these scores onto the MSA [1]. The server identifies columns and sequences that are unreliably aligned and enables their automatic removal from the MSA, in preparation for downstream analyses.

Three algorithms for quantifying MSA uncertainty are implemented in the server. The GUIDANCE score is based on the robustness of the MSA to guide-tree uncertainty and relies on the bootstrap approach [2]. The Heads-or-Tails (HoT) score measures alignment uncertainty due to co-optimal solutions [3].

GUIDANCE3/GUIDANCE2 is an integrative methodology that accounts for: (1) uncertainty in the process of indel formation; (2) uncertainty in the assumed guide tree; (3) co-optimal solutions in the pairwise alignments used as building blocks in progressive alignment algorithms (as HoT).


What is GUIDANCE good for?


GUIDANCE is meant to be used for weighting, filtering, or masking unreliably aligned positions in sequence alignments before subsequent analysis. Analyses where GUIDANCE filtering could be useful include phylogeny reconstruction, reconstruction of the history of specific insertion and deletion events, inference of recombination events, etc.

GUIDANCE2 and GUIDANCE3 also provide a set of alternative alignments that can be used when adopting a statistical point of view, i.e., performing statistical analyses that rely on many possible alignments that are supported by the data. The set of alternative MSAs can also be concatenated to improve phylogenetic accuracy by averaging over alignment uncertainty. Additionally, selecting the best predicted MSA using the GUIDANCE3 deep learning model (see Methodology) has been shown to improve phylogeny estimation compared to using a single default alignment.


What is GUIDANCE not good for?


GUIDANCE scores cannot tell you which alignment is better. For example, align the same sequences using either PRANK or MAFFT and assign GUIDANCE scores to both. If the PRANK alignment has an average score of 0.8 while the MAFFT alignment has a score of 1, this does not mean that the MAFFT alignment is more accurate. GUIDANCE measures the robustness of the alignment, so a perfect score means that MAFFT will consistently align the sequences in the same way, regardless of the perturbations introduced by GUIDANCE. Still, this alignment may be consistently wrong. Therefore, GUIDANCE scores cannot be used to choose between alternative alignments. They can only be used to evaluate a given alignment produced by a specific alignment program and identify columns for which the aligner is less confident relative to other columns in the same alignment. GUIDANCE3 addresses this limitation through its deep learning–based MSA selection, which can identify the most accurate alignment among the generated alternatives (see Methodology).

GUIDANCE is also not appropriate for evaluating an alignment produced by an approach other than those supported in GUIDANCE (MAFFT, PRANK, and Clustal Omega). For example, you should not run GUIDANCE on an alignment produced by T-COFFEE. Likewise, do not upload to GUIDANCE an alignment that you corrected manually, even if it was originally produced by one of the supported aligners. Similarly, alignments generated using special features (e.g., MAFFT alignment that uses RNA structure information) cannot be evaluated by GUIDANCE. In general, we recommend always uploading unaligned sequences and avoiding the option to upload aligned sequences.


Input


  • The minimal input to the GUIDANCE server


DNA, RNA, or protein sequences.
The sequences should be provided in FASTA format only. Other sequence file formats, such as Clustal and Phylip, may be converted to FASTA using software such as READSEQ. The sequence type (nucleotides, codons, or amino acids) should be specified.

MSA algorithm according to which the sequences will be aligned.
The same algorithm is then used to align the sequences while using bootstrap trees as guide trees (see methodology). The server supports three progressive alignment algorithms: MAFFT [5], PRANK [6], and Clustal Omega [4].

Preferred methodology for quantifying MSA uncertainty: GUIDANCE3 or HoT.
The default is GUIDANCE3, which tends to outperform other methods.
  • Advanced Options

Number of bootstrap repeats (not relevant to the HoT measure).
The methodology is based on the bootstrap approach (see below). The higher this number, the more accurate the confidence scores, but the running time also increases linearly. The default value is 100.

Output order.
This option defines the order of the sequences in the output alignment. Some alignment algorithms (e.g., Clustal Omega [4]) change the sequence order. By default, the order of the sequences corresponds to their order after alignment by the selected MSA algorithm. The user may choose instead to preserve the order of the sequences as they appear in the input file.

Input MSA.
The server allows users to upload their own MSA file instead of the unaligned sequence file. In this case, the input MSA is used as the base MSA, and the confidence scores are calculated in the same way as usual (see Methodology below). This option should be used with caution. It is useful for analyzing an MSA of interest, for example, an MSA that was generated using a more accurate guide tree than the standard neighbor-joining tree. However, it is important to remember that even when the base MSA is given as input, the alignment algorithm chosen is applied many times in order to generate each of the perturbed MSAs. Therefore, supplying an MSA created by one program and inferring its confidence using another program may result in false predictions.

Advanced MAFFT/PRANK options.
Advanced users can also alter the parameters passed on to the alignment program used. For example, by default, the server runs PRANK with the .+F. flag, but the experienced user may wish to remove that option in some cases (see http://wasabiapp.org/software/prank/). For MAFFT, the user may enable the iterative refinement option and set the number of iterations in the MAXITERATE parameter. Additionally, an option to choose between the iterative refinement strategies genafpair, localpair, and globalair is provided when running MAFFT. See the MAFFT website for a description of these options (http://mafft.cbrc.jp/alignment/software/algorithms/algorithms.html).


Methodology


What are the GUIDANCE scores?


GUIDANCE scores reflect the robustness of an alignment to perturbations.

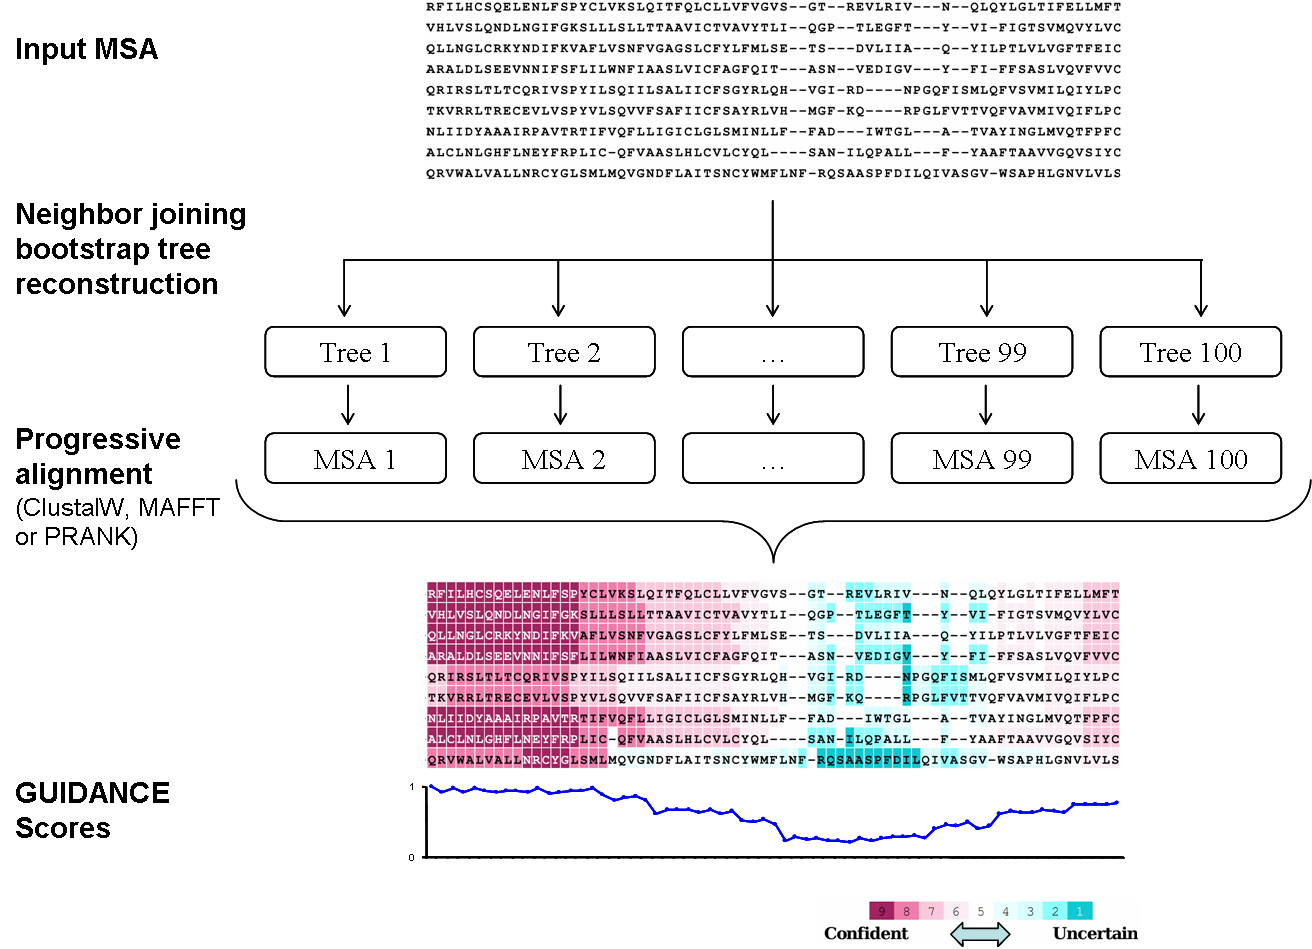
For this goal, a standard MSA is first generated, hereby termed "base MSA". The user may choose between MAFFT (the FFT-NS-1 variant) [5], PRANK [6], and Clustal Omega [4]. The main idea behind the GUIDANCE3 / GUIDANCE2 and GUIDANCE methodologies is to construct a set of MSAs. GUIDANCE uses bootstrap trees as guide-trees to the alignment algorithm, and compare them to the base MSA in order to estimate its confidence level (Figure 1). Similarly, GUIDANCE2 and GUIDANCE3 use bootstrap trees, vary the gap penalty score of the alignment program scoring scheme, and employ HoT methodology (see details below). Comparing the base alignment to the set of alternative alignments results in scores between 0-1 for each residue, residue-pair, column and sequence of the MSA.

An in-depth description of the algorithm behind GUIDANCE can be found in ref. [2].

Constructing the set of MSAs.
Neighbor joining [7] bootstrap trees [8] are first constructed from the base MSA. Next, each bootstrap tree is given as an input guide tree to the alignment algorithm.

Calculation of the GUIDANCE scores.
The method assigns a confidence score for each residue-pair in the base MSA, which is the proportion of MSAs where this pair is aligned together. The confidence score of each column/sequence is simply the average of the GUIDANCE scores over all pairs in it. The confidence score of each residue is calculated by averaging the GUIDANCE residue-pair scores over all pairs that include the residue in question.


    FIGURE 1 A schematic flowchart of the GUIDANCE algorithm. A base MSA is produced by any progressive alignment method. Bootstrap neighbor joining (NJ) trees are reconstructed and given as guide trees to the progressive alignment program, producing a set of MSAs. GUIDANCE scores are then calculated by comparing each MSA to the base MSA, and are color coded on each residue in the alignment.

What are the HoT scores?


HoT (Heads-or-Tails) scores measure the alignment uncertainty by generating a set of co-optimal MSAs and comparing them to the standard alignment. Co-optimal MSAs are a set of alignments that are given the same maximal score by the alignment algorithm. The co-optimal MSAs set is constructed by reversing the sequences at each of the pairwise-profiles-alignment steps of the progressive alignment algorithm [3]. The comparison results in scores between 0-1 for each residue, residue-pair, column and sequence of the MSA.

Deep learning-based MSA selection (GUIDANCE3)


While the GUIDANCE2 and HoT scores assess the reliability of a given alignment, they cannot determine which of several alternative alignments is the most accurate. Most widely used MSA methods optimize the sum-of-pairs (SoP) score, yet the alignment with the optimal SoP score often does not correspond to the most accurate alignment when compared to a reference.

GUIDANCE3 addresses this limitation by incorporating a deep learning model that integrates a collection of MSA features to identify the best alignment from the set of alternatives generated during the bootstrap procedure. The model takes as input the full set of alternative MSAs produced from the same unaligned sequences and predicts their relative ranking with respect to alignment accuracy. Across simulated and empirical datasets, this approach more accurately identifies the top-ranking MSA than the SoP score and several widely used alignment programs. Using simulations, selecting MSAs based on this model has also been shown to lead to more accurate phylogenetic reconstructions.

The deep learning model is available both through the GUIDANCE3 web server and as a standalone Command Line Interface (CLI) tool (guidance3-predict), which accepts a folder of alternative MSAs and returns the predicted best alignment together with a ranked list of all alternatives.

Running time


Running time depends on the dataset size (number and length of sequences) and (for GUIDANCE/GUIDANCE2/GUIDANCE3 scores) on the number of bootstrap repeats. The major component of the running time is the multiple alignment program used, thus MAFFT runs will be fastest and PRANK runs slowest. In Figure 2, a comparison between the running time of GUIDANCE2 and other MSA reliability methods when using MAFFT as the alignment method. Note that GUIDANCE2 and GUIDANCE were run with the default 100 bootstrap repeats, but this number can be reduced to shorten the running time. HoT running time depends on the number of branches in the guide tree, which increases linearly with the number of sequences. Zorro, TCS, ALiScore, TrimAl and NOISY were run on a pre-calculated MSA.
Please note that the GUIDANCE3 supports parallel computing and early convergence stopping, thus a significant reduction in running times is possible. In addition, GUIDANCE3 uses IQ-TREE for guide-tree inference (replacing SEMPHY used in GUIDANCE2), which natively supports multi-threading and further improves running time.
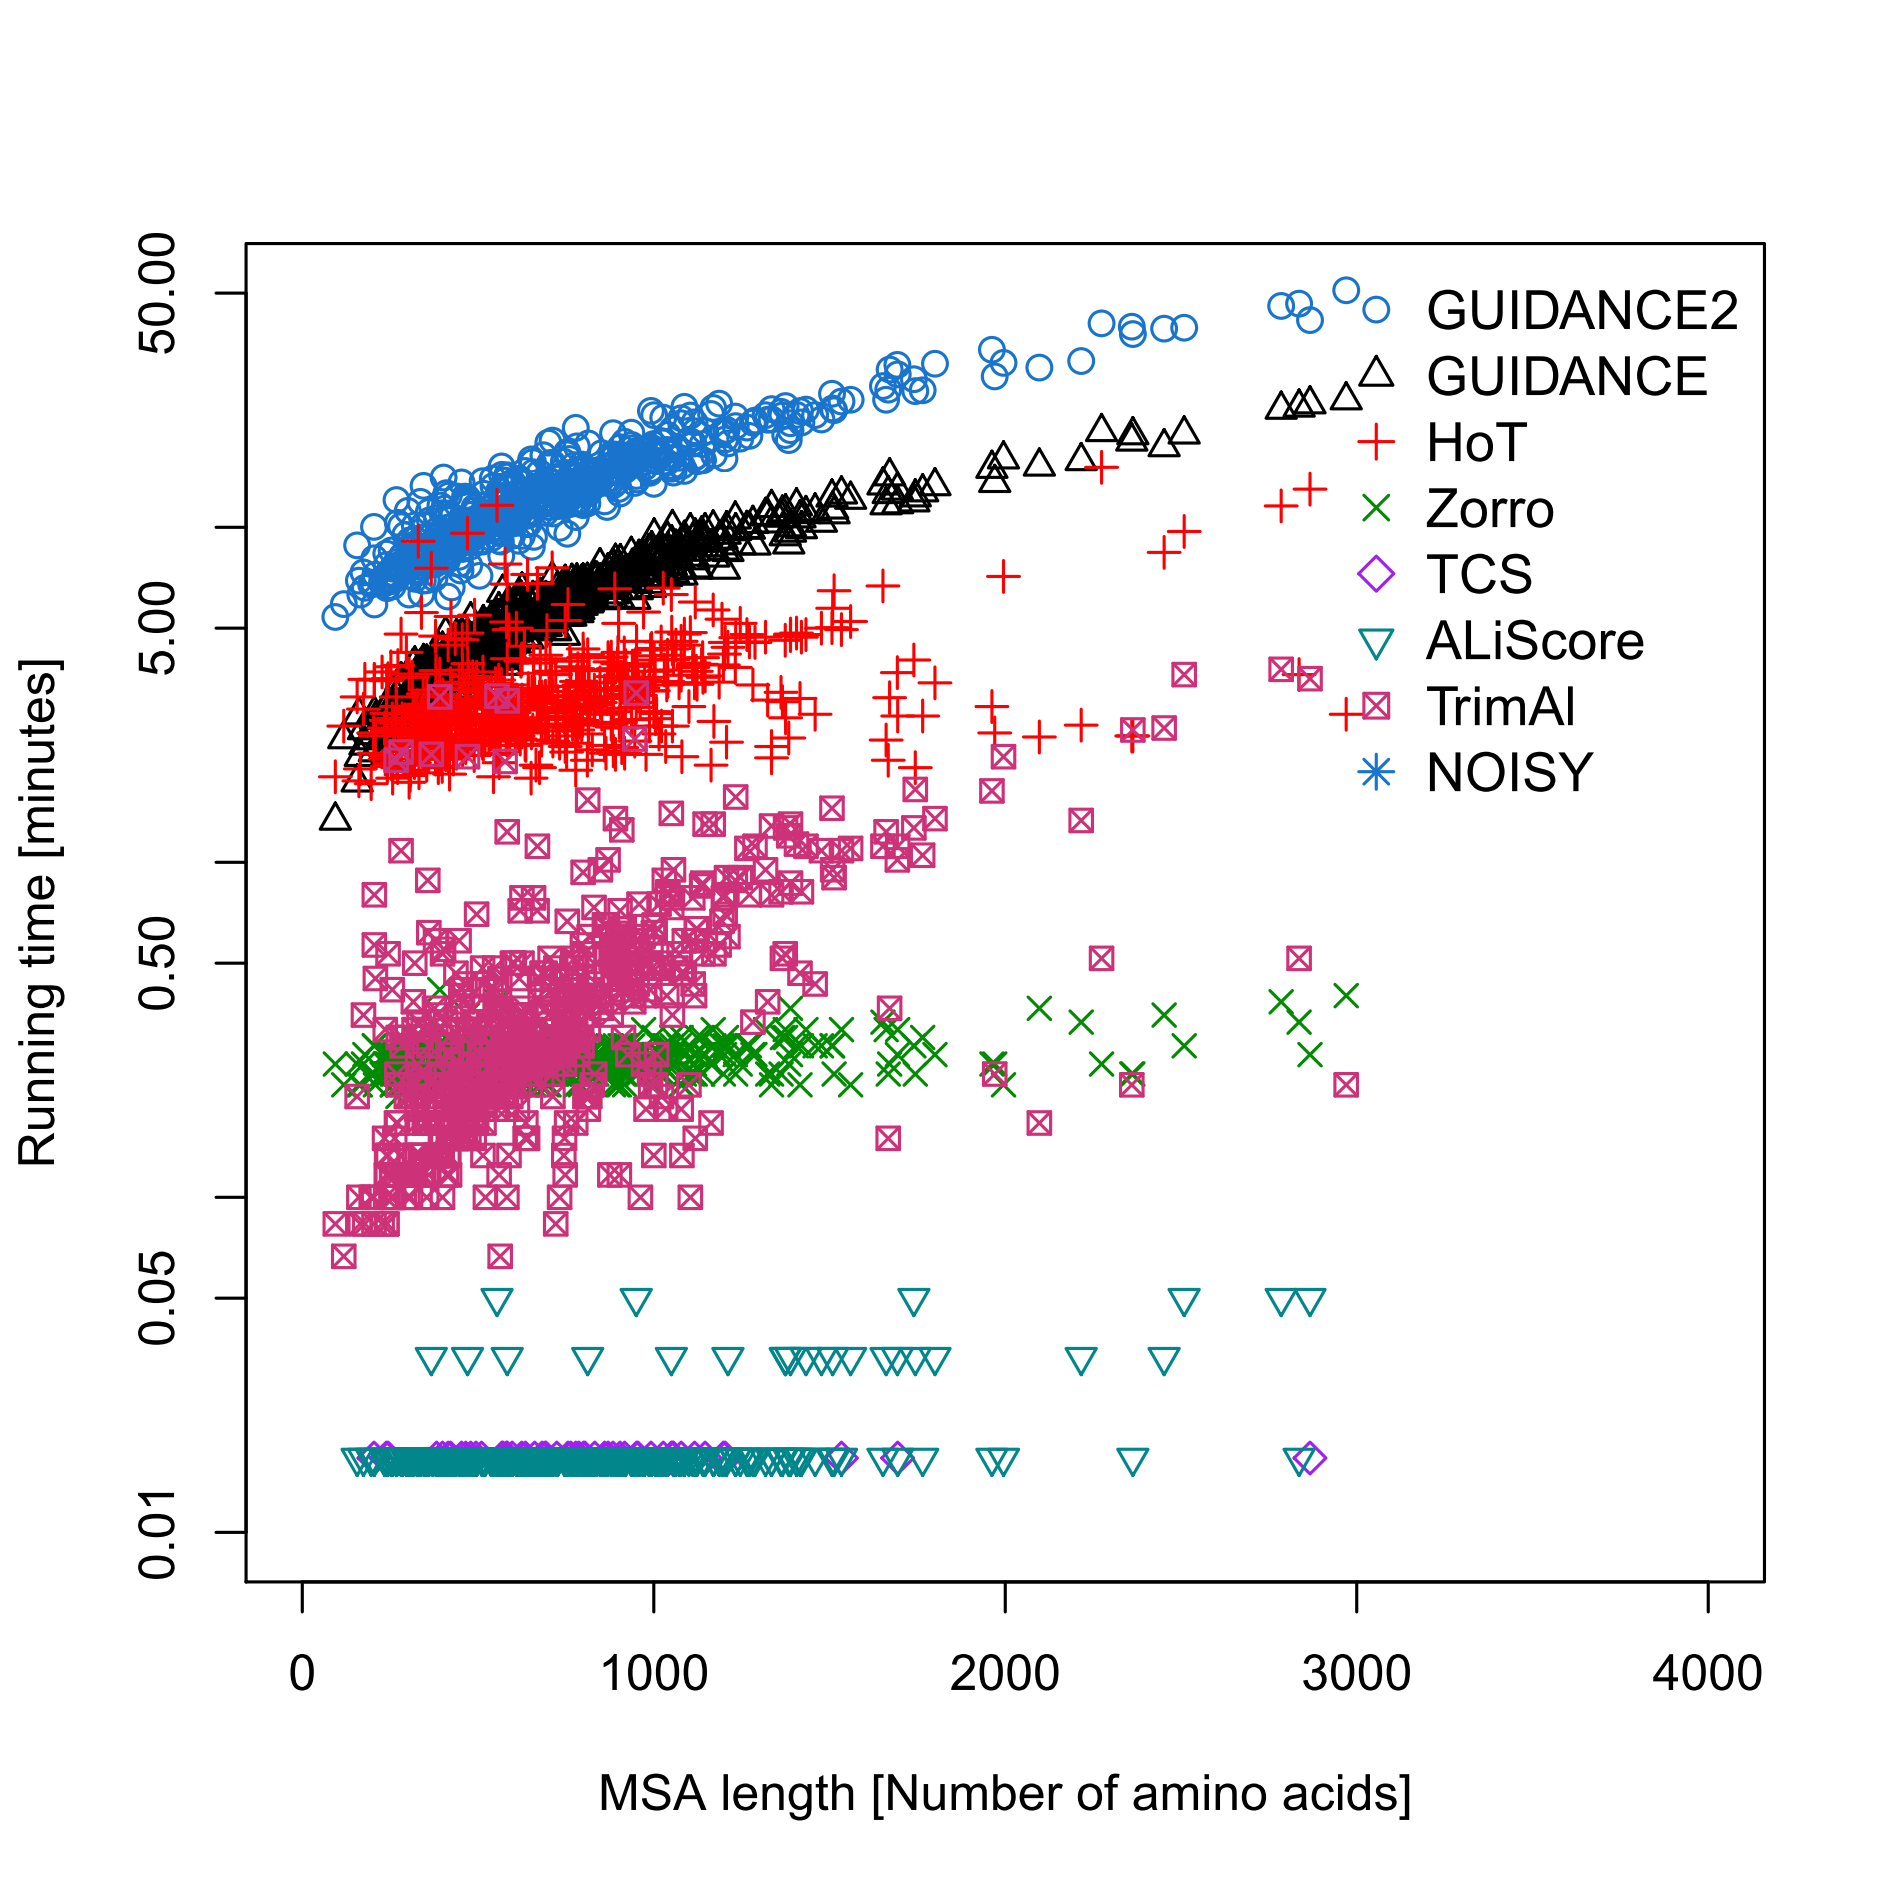


FIGURE 2: Time performance as a function of the sequence length. Sets of 40 simulated protein sequences with different lengths were aligned using MAFFT and analyzed by alignment reliability methods.


Output


GUIDANCE directs you to a web page called "GUIDANCE Job Status Page". This web page is automatically updated every 30 seconds, showing messages regarding the different stages of the server activity. When the calculation finishes, several links appear. For simplicity, we only describe the output of the GUIDANCE method. Similar output is produced by the HoT method, also implemented in this server.

Best MSA GUIDANCE3
The alignment that is predicted by the deep learning model to be the most accurate among the alternative MSAs generated using GUIDANCE. Unlike the SoP score, which only accounts for pairwise substitutions and gaps, the deep learning model integrates multiple MSA features, e.g., k-mer frequencies and column conservation, to rank alternatives by their proximity to a true reference alignment. This MSA is recommended for downstream analyses such as phylogenetic reconstruction. See the Methodology section for details.

Alternative MSAs GUIDANCE2 / GUIDANCE3
The full set of alternative MSAs produced by the GUIDANCE algorithm — through perturbations of the guide tree, gap-penalty variations, and co-optimal solutions (HoT) — is available for download. These can be concatenated to improve phylogenetic accuracy by averaging over alignment uncertainty. Alternatively, downstream statistical analyses that rely on a single MSA can be tested with several alternative MSAs, in order to verify that the results are robust with respect to the exact MSA assumed. Ideally, downstream analyses should explicitly account for alignment uncertainty by averaging over alternative alignments.

MSA colored according to the confidence score
This link is the main link for the GUIDANCE output, which is a projection of the confidence scores of each residue onto the MSA, using a color scale. Shades of magenta indicate confidently aligned residues, while shades of blue indicate uncertainly aligned residues. In addition, the GUIDANCE column scores are plotted below the alignment.

MSA file
This links to a plain-text file of the base MSA, on which the colored results are being displayed.

GUIDANCE column score
Here you can find a table of GUIDANCE scores obtained for each column of the MSA. Note that the score of columns containing only one sequence can not be estimated and thus not presented.

GUIDANCE residue score
Here you can find a table of GUIDANCE scores obtained for each residue in the MSA. Note that the score of residues that are aligned to gaps only can not be estimated. They are not listed in the table.

GUIDANCE sequence score
Here you can find a table of GUIDANCE scores obtained for each sequence in the MSA.

GUIDANCE residue-pair score
Here you can find a table of GUIDANCE scores obtained for each residue-pair in the MSA.

Remove unreliable columns below a certain cutoff
The server provides a reduced MSA by removing unreliable columns according to this given cutoff. This MSA contains only columns with a GUIDANCE score (see "what are the GUIDANCE scores") higher than this cutoff, and is recommended to be used in subsequent analyses in order to reduce errors caused by alignment errors. There is no specific recommended value for this cutoff because its effect on the alignment varies considerably among datasets. After the GUIDANCE calculation is finished, the user may select from a drop-down list to remove unreliable columns below a certain confidence score. When selecting a confidence score, the user can see what percentage of the original columns remain in the MSA. After choosing the appropriate confidence level and clicking the "remove columns" button, the GUIDANCE server provides a hyperlink to a new reduced MSA comprised of the confidently aligned columns only. The default value, 0.93, was optimized for the BAliBASE benchmark database as well as for simulation studies, and corresponds to 12% false positive rate and 78% true positive rate. The user is allowed to change this cutoff to retain more or fewer columns. The tradeoff, as for many other predictive tests, is between the sensitivity and specificity levels. Using a low cutoff is recommended for applications that require leaving as many accurate MSA columns as possible (i.e., high sensitivity). Other applications may require the use of confident columns only (i.e., high specificity), and thus, using a high cutoff that removes many columns from the original MSA is recommended. A table describing the false-positive rate and the true-positive rate found in simulation studies for different cutoffs can be found here: "Table 1".

Remove unreliable sequences below a certain cutoff
According to this cutoff, the server enables the removal of sequences that cause errors in the MSA because their alignment with the rest of the sequences is unreliable. The reduced MSA contains only sequences with a GUIDANCE score (see "what are the GUIDANCE scores") higher than this cutoff and can be used for subsequent analyses in order to reduce errors caused by alignment errors. It is possible to change this cutoff according to the proportion of sequences that the user wishes to retain. There is no specific recommended value for this cutoff because its effect on the alignment varies considerably among datasets. The web server provides a list of cutoffs with their respective effects on the remaining proportion of sequences, and users are encouraged to experiment with several cutoffs. We recommend running GUIDANCE again using these sequences as input, in order to follow the improvement of the confidence level. This can be done by simply pressing the "run GUIDANCE on the confidently-aligned sequences only" button.

Mask specific residues below a certain cutoff
The GUIDANCE residue scores indicate specific residues whose alignment is unreliable (see "what are the GUIDANCE scores"). This allows masking of specific residues instead of the removal of whole columns or sequences. All residues with scores lower than the cutoff are replaced with "N" (for nucleotides) or "X" (for amino acids). This is useful, for example, to mask codons in a codon alignment before running a Ka/Ks analysis to look for positive selection (see application in ref. 9)

Simulated benchmark


Among other benchmarks used to evaluate the performance of GUIDANCE2 we used a benchmark of 541 simulated protein sequences. Sequences were simulated using INDELible. In order to have realistic parameters for the simulations, we first selected 541 MSAs from the OrthoMaM database, for which CDS are available for all 40 mammals included in the database. This parameter setup resulted in MSAs similar to OrthoMaM alignments (visual comparison of alignment length, number and length of indels). The control files for INDELible and the resulted simulated MSAs used as benchmark can be downloaded here.

  • References

    1. Penn, O., E. Privman, H. Ashkenazy, G. Landan, D. Graur, and T. Pupko. (2010). GUIDANCE: a web server for assessing alignment confidence scores. Nucleic Acids Research, 2010 Jul 1; 38 (Web Server issue):W23-W28; doi: 10.1093/nar/gkq443
    2. Penn, O., E. Privman, G. Landan, D. Graur, and T. Pupko. (2010). An alignment confidence score capturing robustness to guide-tree uncertainty. Molecular Biology and Evolution, 2010 Aug;27(8):1759-67; doi:10.1093/molbev/msq066
    3. Landan, G. and D. Graur, Local reliability measures from sets of co-optimal multiple sequence alignments. Pac Symp Biocomput, 2008. 13: p. 15-24.
    4. Sievers, F., et al., Fast, scalable generation of high-quality protein multiple sequence alignments using Clustal Omega. Mol Syst Biol, 2011. 7: p. 539. doi:10.1038/msb.2011.75
    5. Katoh, K., et al., MAFFT version 5: improvement in accuracy of multiple sequence alignment. Nucleic Acids Res, 2005. 33(2): p. 511-8.
    6. Loytynoja, A. and N. Goldman, Phylogeny-aware gap placement prevents errors in sequence alignment and evolutionary analysis. Science, 2008. 320(5883): p. 1632-5.
    7. Saitou, N. and M. Nei, The neighbor-joining method: a new method for reconstructing phylogenetic trees. Mol Biol Evol, 1987. 4(4): p. 406-25.
    8. Felsenstein, J., Confidence limits on phylogenies: an approach using the bootstrap. Evolution, 1985. 39(4): p. 783-791.
    9. Privman, E., O. Penn, and T. Pupko. Improving the performance of positive selection inference by filtering unreliable alignment regions. MBE, 2011. doi: 10.1093/molbev/msr177.